
What separates successful online retailers from those who struggle despite having great products? The answer often lies in the numbers—or more precisely: in understanding the right numbers. Because if you only look at revenue, you’re only seeing the tip of the iceberg.
In this comprehensive guide, I’ll show you all the relevant KPIs (Key Performance Indicators) you need to know for a successful e-commerce business. With concrete formulas, example calculations, and industry benchmarks so you can not only understand your metrics but also put them in context.
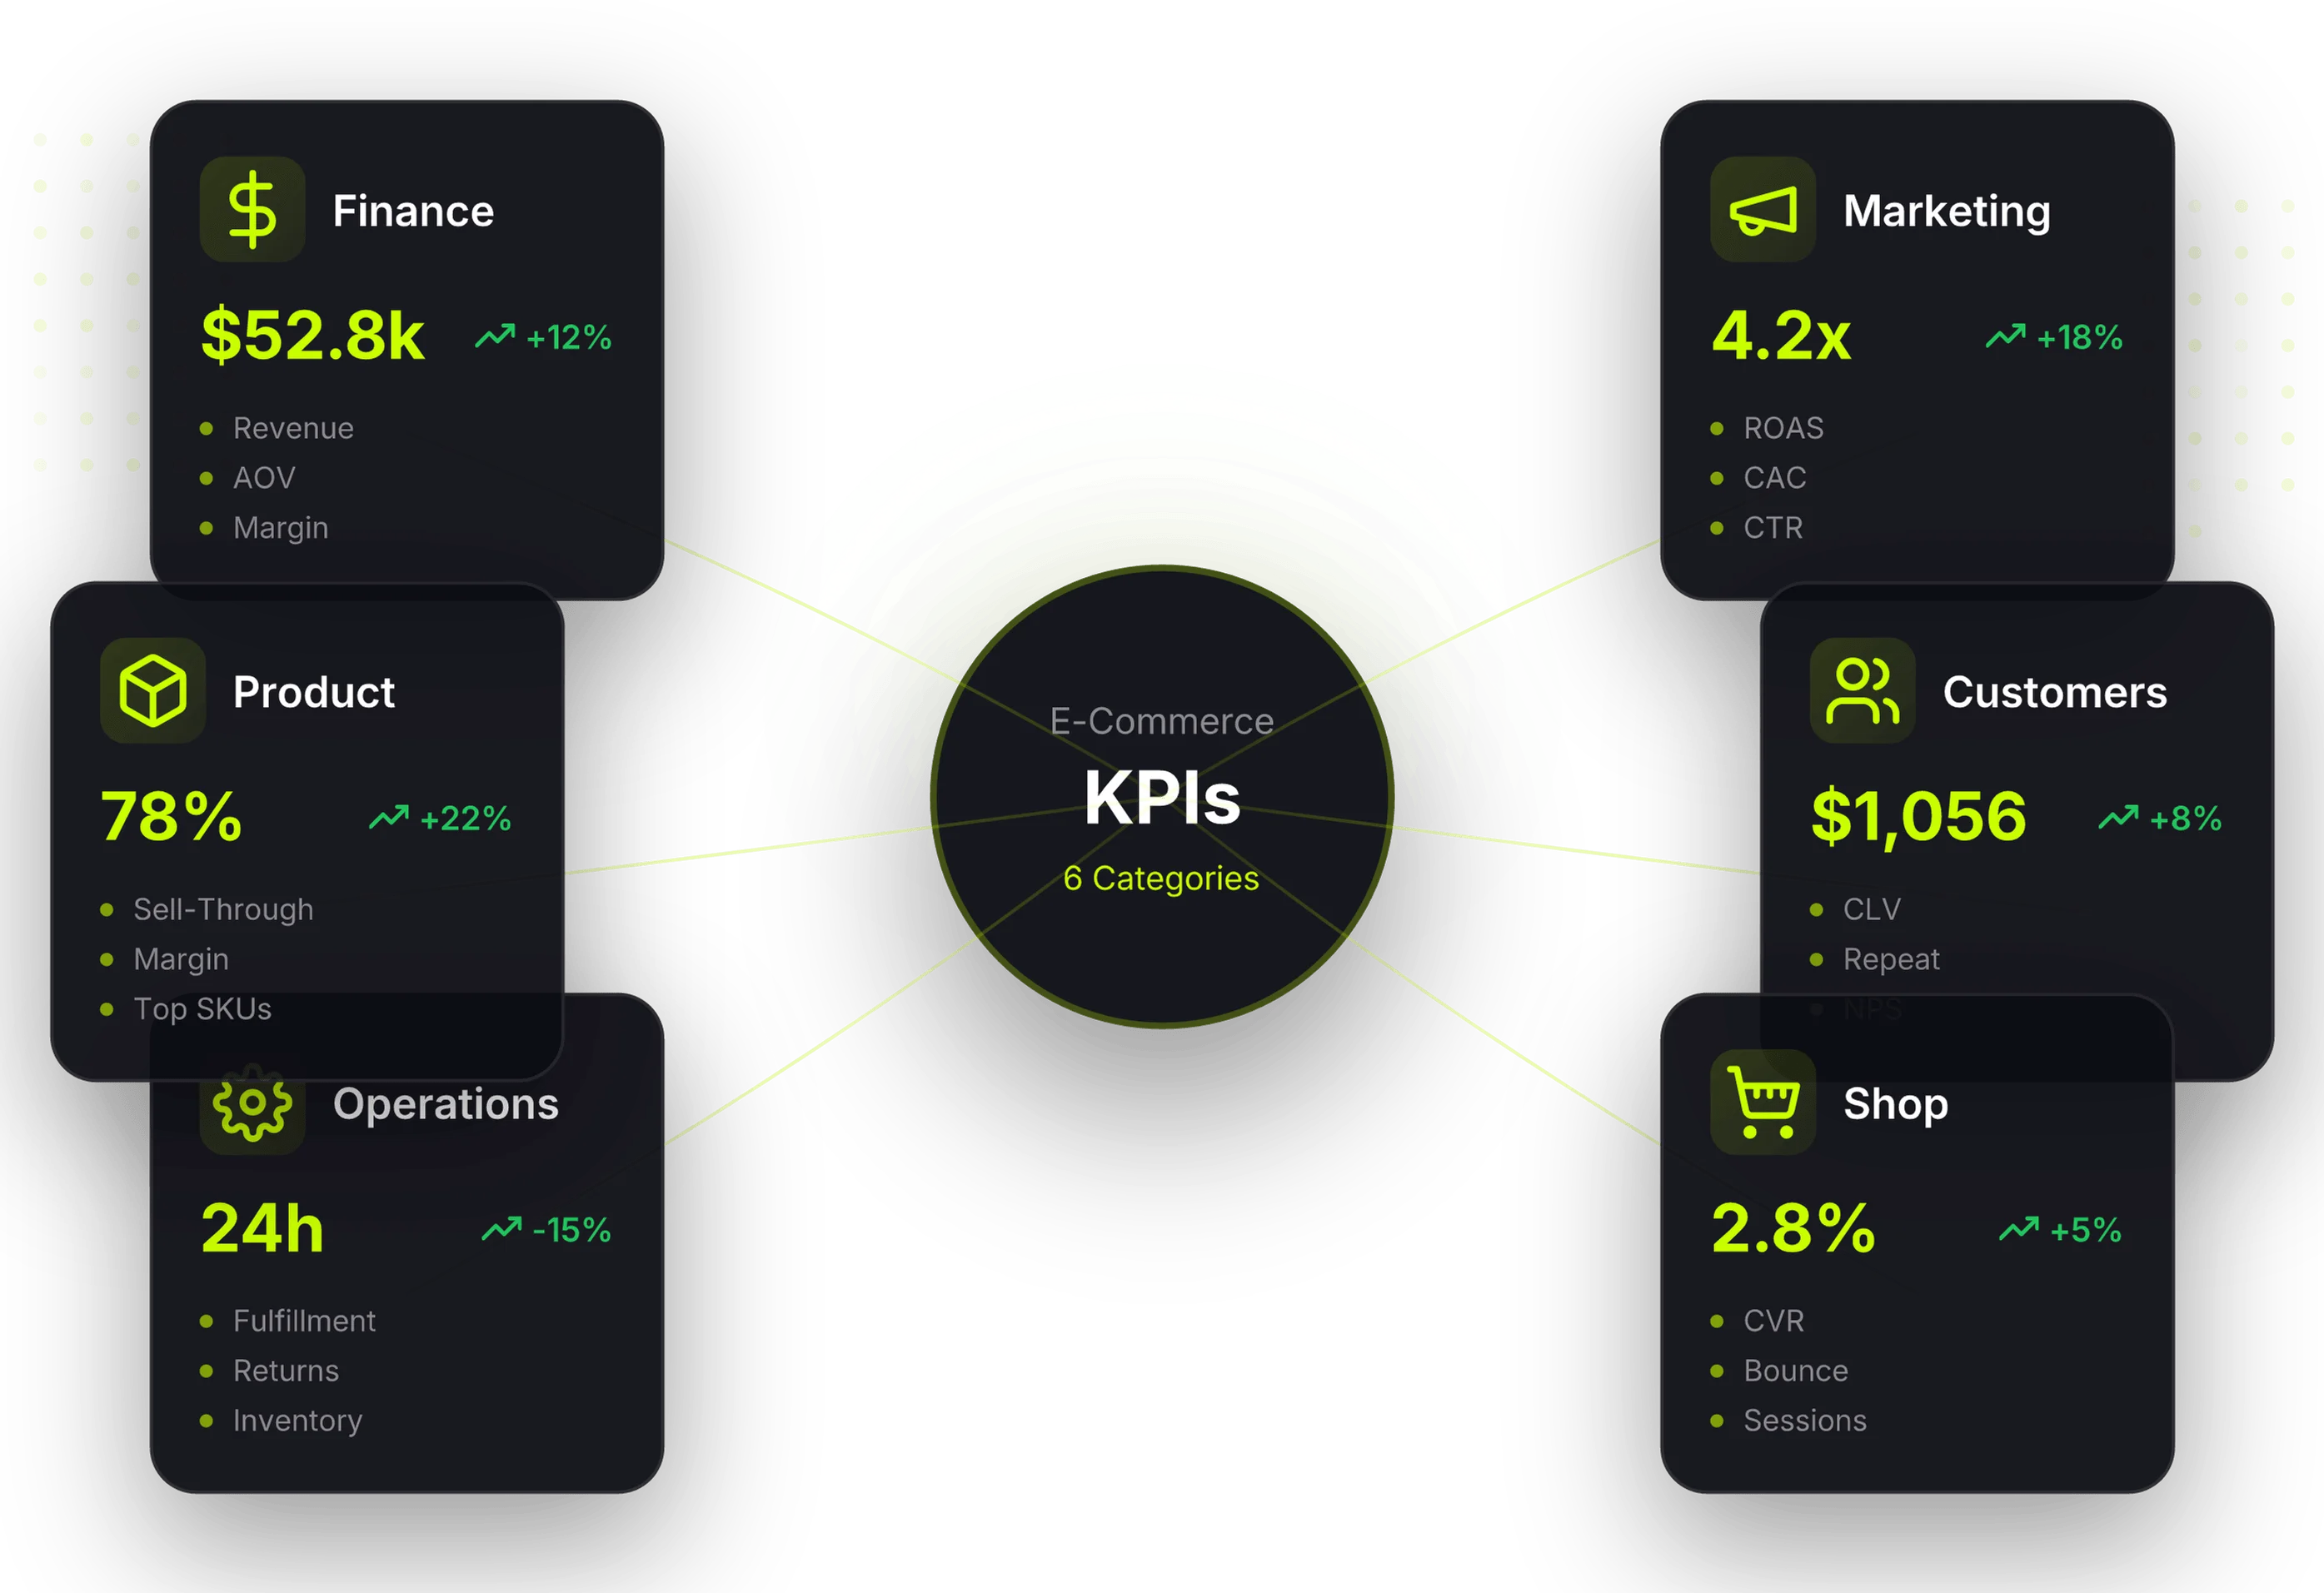
Why KPIs Are Essential in E-Commerce
Many online retailers make a fundamental mistake: they focus exclusively on revenue. But revenue alone says little about the health of an e-commerce business. A company can generate millions in revenue and still lose money—for example, because customer acquisition is too expensive or returns eat up all the profit.
KPIs enable you to:
- Early detection of problems: Before they impact revenue
- Informed decisions: Based on data instead of gut feeling
- Targeted optimization: You know exactly where to apply leverage
- Comparability: With industry benchmarks and your own history
1. Financial KPIs: The Foundation of Your Business Success
Financial metrics form the foundation of any e-commerce analysis. They show whether your business model is viable.
Revenue
Revenue is the most obvious metric—but pay attention to the distinction:
- Gross Revenue: Total income before deductions
- Net Revenue: Gross revenue minus returns, discounts, and taxes
Net Revenue Formula:

Average Order Value (AOV)
AOV shows how much a customer spends on average per order. It’s an important lever for profitability.
Formula:

Example Calculation:
- Monthly Revenue: $165,000
- Number of Orders: 2,000
- AOV = $165,000 / 2,000 = $82.50
Industry Benchmarks AOV:
| Industry | Average AOV |
|---|---|
| Fashion & Apparel | $90–135 |
| Electronics | $170–340 |
| Beauty & Cosmetics | $50–80 |
| Furniture & Home | $225–565 |
| Groceries | $45–70 |
Contribution Margin
The contribution margin shows what remains after deducting variable costs. It’s more meaningful than pure revenue.
Formula:


Variable costs in e-commerce typically include:
- Cost of goods sold (purchase price)
- Shipping costs
- Payment fees (PayPal, credit card, etc.)
- Packaging
- Marketing costs (when attributable to orders)
Example Calculation:
- Selling price: $110
- Purchase price: $44
- Shipping: $5.50
- Payment fees: $3.30
- Packaging: $2.20
- Contribution Margin = $110 - $55 = $55 (50%)
Profit Margin
The profit margin shows what percentage of revenue remains as profit.
Gross Margin:

Net Margin:


Industry Benchmarks Gross Margin:
| Industry | Typical Gross Margin |
|---|---|
| Fashion | 50–60% |
| Electronics | 15–25% |
| Beauty | 60–70% |
| Furniture | 40–50% |
| Groceries | 20–35% |
Break-Even Point
The break-even point shows when you start operating profitably.
Formula:


Example Calculation:
- Monthly Fixed Costs: $22,000
- Contribution Margin per Order: $55
- Break-Even = $22,000 / $55 = 400 Orders
You need to generate at least 400 orders per month to break even.
2. Marketing KPIs: The Efficiency of Your Customer Acquisition
Marketing metrics show how efficiently you acquire new customers and reactivate existing ones.
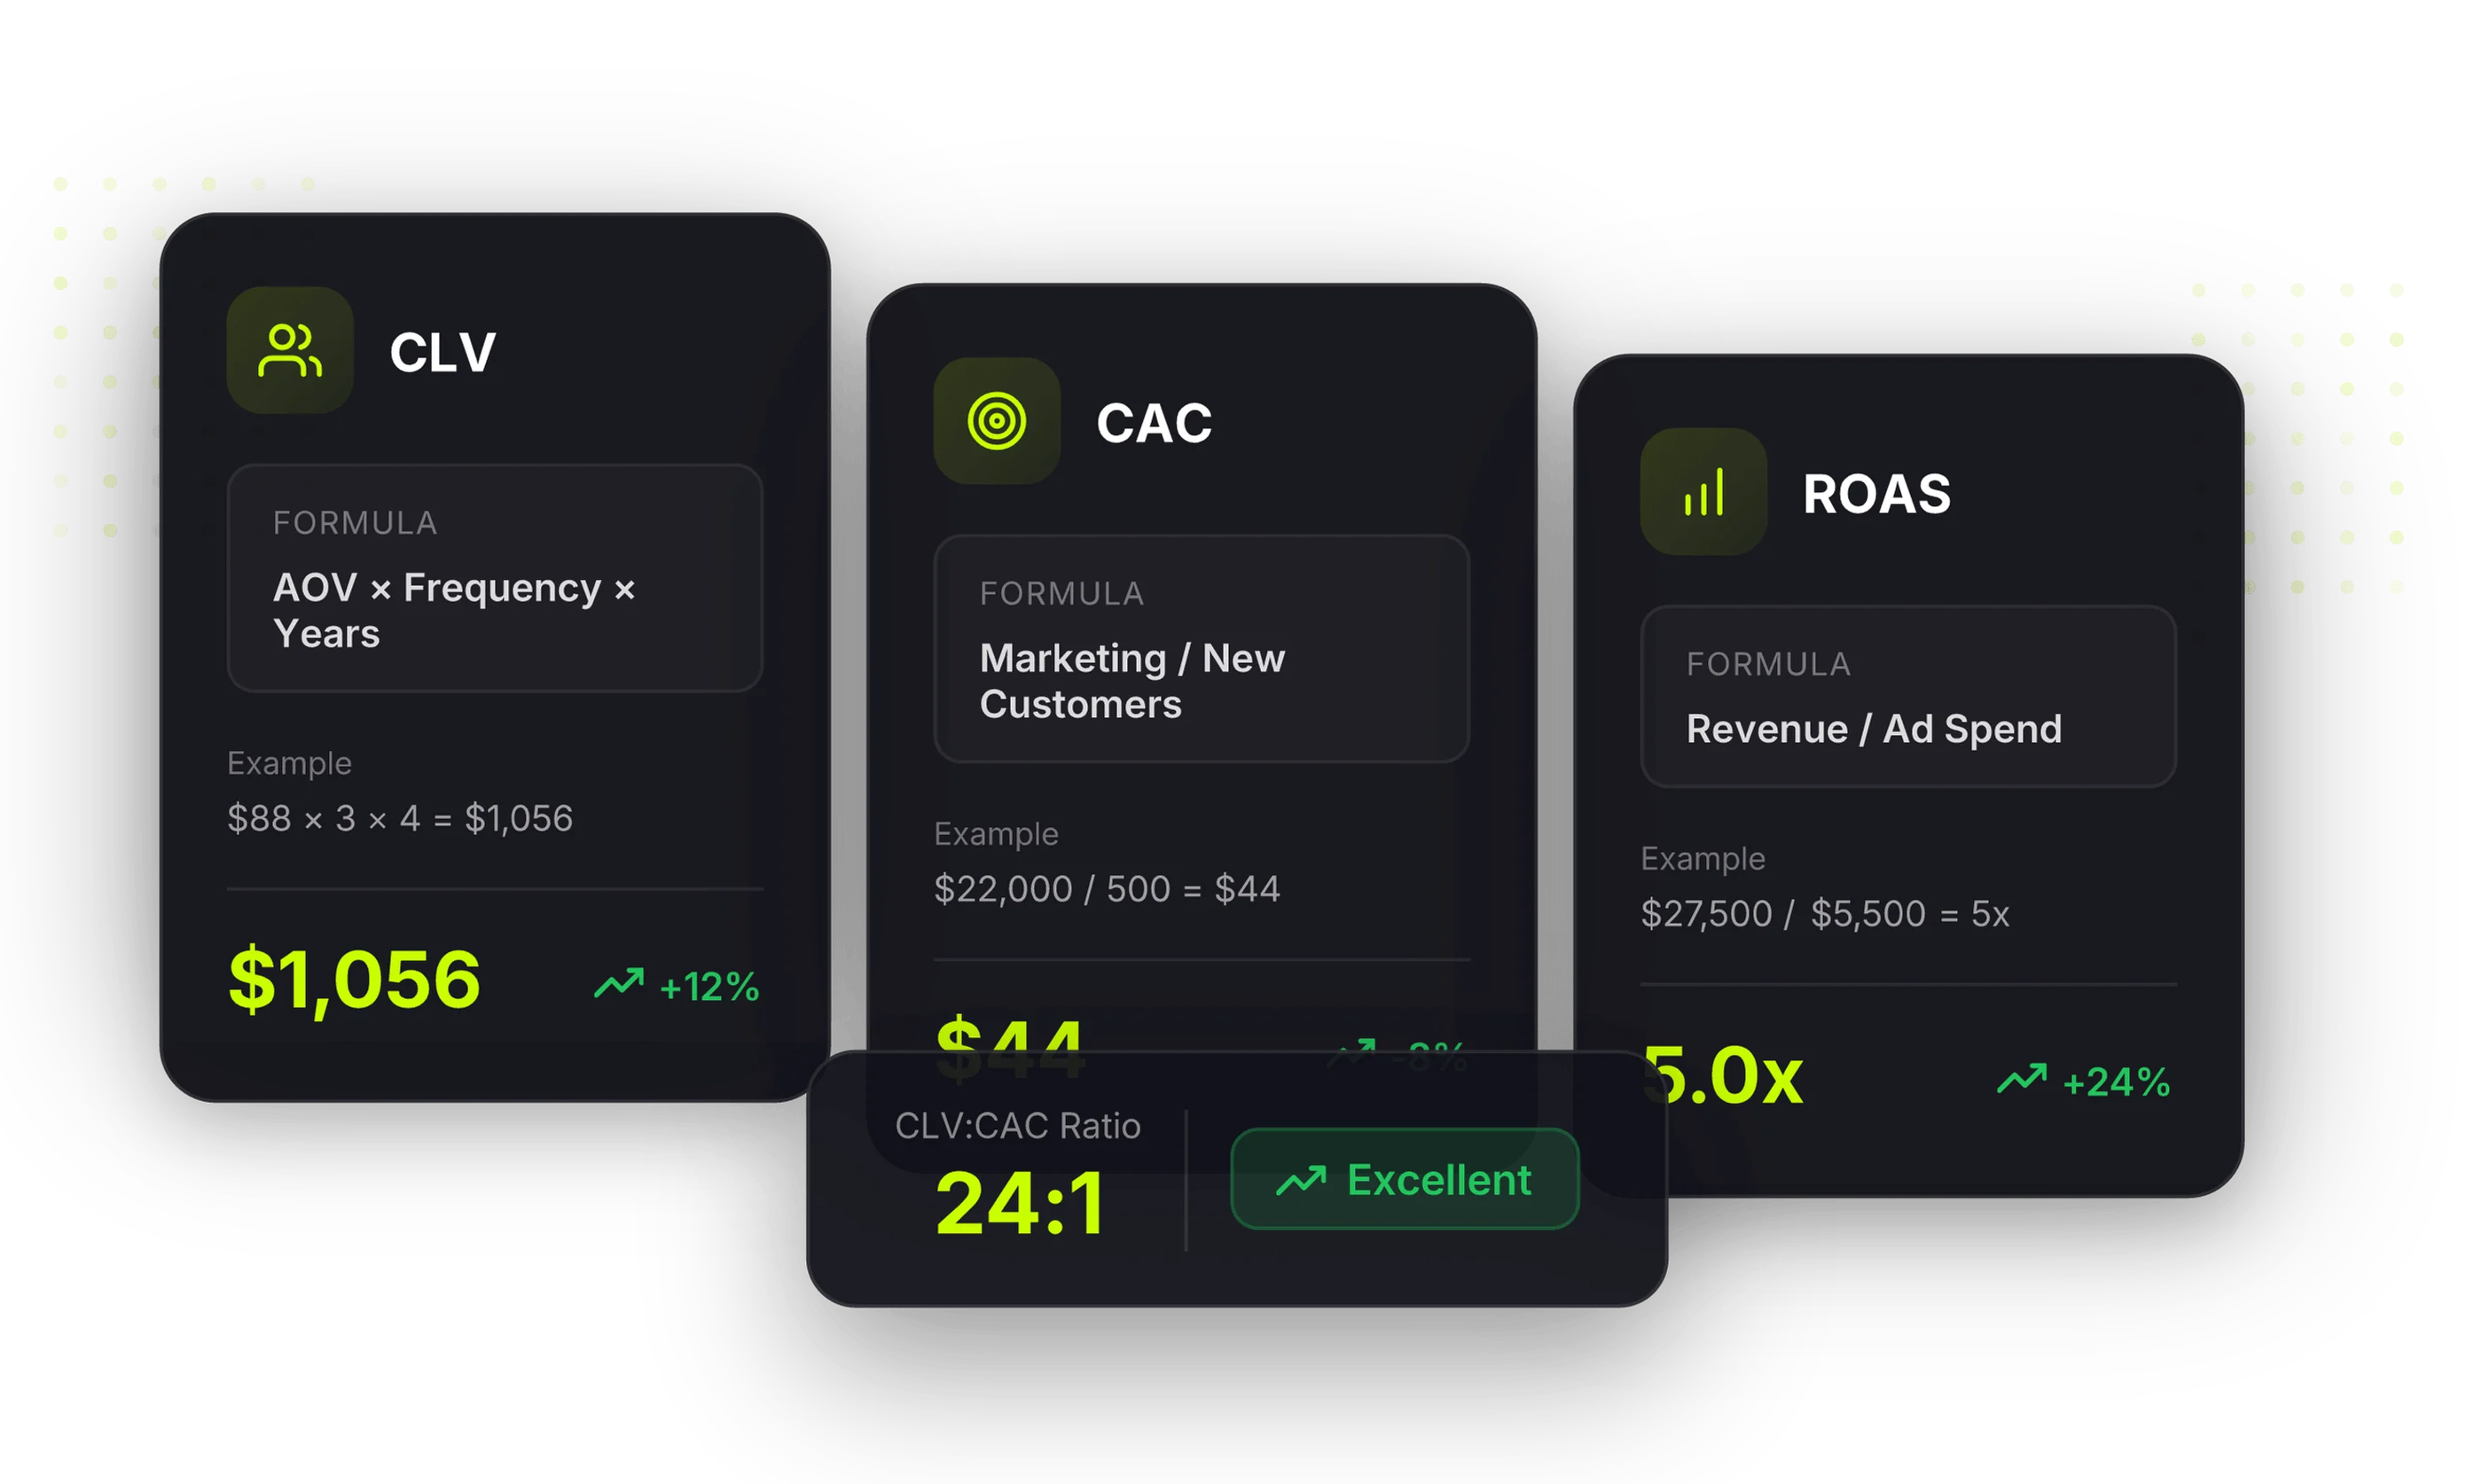
Customer Acquisition Cost (CAC)
Customer acquisition costs show how much you need to spend to acquire a new customer.
Formula:
Example Calculation:
- Monthly Marketing Spend: $16,500
- Sales Costs: $5,500
- New Customers Acquired: 500
- CAC = $22,000 / 500 = $44
Industry Benchmarks CAC:
| Industry | Typical CAC |
|---|---|
| Fashion | $33–55 |
| Beauty | $22–44 |
| Electronics | $55–110 |
| Furniture | $110–220 |
| Subscription Models | $55–165 |
Return on Ad Spend (ROAS)
ROAS shows how much revenue each invested advertising dollar generates.
Formula:

Example Calculation:
- Google Ads Spend: $5,500
- Generated Revenue: $27,500
- ROAS = $27,500 / $5,500 = 5.0 (or 500%)
What does the ROAS value mean?
| ROAS | Assessment |
|---|---|
| < 2.0 | Critical – review your campaigns |
| 2.0–3.0 | Adequate, but room for optimization |
| 3.0–5.0 | Good – solid performance |
| > 5.0 | Very good – scale up! |
Cost per Click (CPC) and Cost per Mille (CPM)
CPC (Cost per Click):


CPM (Cost per 1,000 Impressions):

Industry Benchmarks CPC (Google Ads):
| Industry | Average CPC |
|---|---|
| Fashion | $0.55–1.65 |
| Electronics | $0.88–2.20 |
| Beauty | $0.44–1.32 |
| Furniture | $1.10–3.30 |
| B2B | $2.20–5.50 |
Click-Through Rate (CTR)
CTR shows what percentage of users who see your ad actually click on it.
Formula:

Industry Benchmarks CTR:
| Channel | Good CTR |
|---|---|
| Google Search Ads | 2–5% |
| Google Display Ads | 0.3–0.5% |
| Facebook/Instagram Ads | 0.9–1.5% |
| Email Marketing | 2–4% |
Conversion Rate (CVR)
The conversion rate is one of the most important metrics overall. It shows what percentage of your visitors actually make a purchase.
Formula:


Example Calculation:
- Monthly Website Visitors: 50,000
- Orders: 1,000
- CVR = (1,000 / 50,000) × 100 = 2.0%
Industry Benchmarks Conversion Rate:
| Industry | Average CVR |
|---|---|
| Fashion | 1.5–2.5% |
| Electronics | 1.0–2.0% |
| Beauty | 2.5–3.5% |
| Furniture | 0.5–1.5% |
| Groceries | 3.0–5.0% |
Marketing Efficiency Ratio (MER)
The MER (also called Blended ROAS) looks at total marketing relative to total revenue.
Formula:


Example Calculation:
- Monthly Total Revenue: $220,000
- Total Marketing Spend: $44,000
- MER = $220,000 / $44,000 = 5.0
MER is more meaningful than individual channel ROAS values because it bypasses attribution problems and shows the big picture.
3. Customer KPIs: The Value of Your Customer Relationships
Customer-focused metrics show how valuable your customer relationships are and how well you retain customers.
Customer Lifetime Value (CLV)
CLV shows how much revenue a customer generates over the entire course of their relationship with your company.
Simple Formula:

Example Calculation:
- Average Order Value: $88
- Purchases per Year: 3
- Average Customer Relationship: 4 years
- CLV = $88 × 3 × 4 = $1,056
Extended Formula (with Margin):

With 50% gross margin:
- CLV (Profit) = $1,056 × 0.5 = $528
CLV:CAC Ratio
The ratio of Customer Lifetime Value to Customer Acquisition Cost shows the profitability of your customer acquisition.
Formula:

Example Calculation:
- CLV: $528 (profit basis)
- CAC: $66
- CLV:CAC Ratio = $528 / $66 = 8:1
Assessment:
| Ratio | Assessment |
|---|---|
| < 1:1 | Critical – you're losing money |
| 1:1–3:1 | Problematic – little margin |
| 3:1–5:1 | Healthy – good business model |
| > 5:1 | Very good – scaling potential |
Repeat Purchase Rate
The repeat purchase rate shows what percentage of your customers buy more than once.
Formula:


Industry Benchmarks:
| Industry | Good Repeat Purchase Rate |
|---|---|
| Fashion | 25–40% |
| Beauty/Cosmetics | 35–50% |
| Groceries | 50–70% |
| Electronics | 15–25% |
Customer Churn Rate
The churn rate shows how many customers you lose in a given period. Particularly relevant for subscription models.
Formula:
Example Calculation:
- Customers at Month Start: 5,000
- Cancellations in Month: 150
- Churn Rate = (150 / 5,000) × 100 = 3%
Annual Churn Rate:
- 3% monthly means approximately 30% annual churn
Net Promoter Score (NPS)
NPS measures customer satisfaction and likelihood to recommend.
Calculation:
- Question: “How likely are you to recommend us?” (0–10)
- Promoters: Answers 9–10
- Detractors: Answers 0–6
- NPS = % Promoters - % Detractors
Assessment:
| NPS | Assessment |
|---|---|
| < 0 | Critical |
| 0–30 | Needs improvement |
| 30–50 | Good |
| 50–70 | Very good |
| > 70 | Excellent |
4. Shop Performance KPIs: The Efficiency of Your Online Store
These metrics show how well your shop converts visitors into buyers.
Conversion Rate by Traffic Source
Not all traffic converts equally well. Analyze CVR by channel:
| Traffic Source | Typical CVR |
|---|---|
| Direct Traffic | 2.5–4.0% |
| 3.0–5.0% | |
| Organic Search | 2.0–3.0% |
| Paid Search | 1.5–2.5% |
| Social Media | 0.5–1.5% |
| Display Ads | 0.3–0.8% |
Cart Abandonment Rate
The cart abandonment rate shows how many customers fill their cart but don’t complete the purchase.
Formula:

Example Calculation:
- Created Carts: 10,000
- Completed Purchases: 3,000
- Cart Abandonment = (1 - 3,000/10,000) × 100 = 70%
Industry Average: 65–75%
Common Reasons for Cart Abandonment:
- Unexpected shipping costs (48%)
- Account creation required (24%)
- Complicated checkout (18%)
- Trust concerns (17%)
- Website errors (13%)
Bounce Rate
The bounce rate shows how many visitors leave the page immediately.
Formula:


Benchmarks:
| Page Type | Acceptable Bounce Rate |
|---|---|
| Homepage | 30–50% |
| Category Page | 25–40% |
| Product Page | 20–35% |
| Blog Article | 60–80% |
| Landing Page | 30–50% |
Average Session Duration & Pages per Session
Session Duration: How long does a visitor stay on your website?
- E-commerce average: 2–3 minutes
- Target: > 3 minutes
Pages per Session: How many pages does a user visit?
- E-commerce average: 4–5 pages
- Target: > 5 pages
5. Operations KPIs: The Efficiency of Your Processes
Operational metrics show how efficiently your logistics and fulfillment work.
Return Rate
The return rate is a critical factor, especially in e-commerce.
Formula:


Industry Benchmarks:
| Industry | Average Return Rate |
|---|---|
| Fashion | 20–30% |
| Shoes | 25–35% |
| Electronics | 10–15% |
| Furniture | 5–10% |
| Beauty | 5–10% |
| Groceries | 1–3% |
Fulfillment Time
The time from order receipt to shipping.
Benchmarks:
- Same-Day Shipping: Orders by 2 PM = shipped same day
- Standard: 24–48 hours
- Acceptable: up to 72 hours
Inventory Turnover
Shows how often inventory is completely sold and replaced per year.
Formula:


Example Calculation:
- Annual COGS: $660,000
- Average Inventory: $110,000
- Inventory Turnover = $660,000 / $110,000 = 6
This means: Inventory turns over 6× per year (every 2 months).
Industry Benchmarks:
| Industry | Typical Inventory Turnover |
|---|---|
| Fashion (Fast Fashion) | 8–12× |
| Fashion (Premium) | 4–6× |
| Electronics | 6–10× |
| Groceries | 15–25× |
| Furniture | 3–5× |
Out-of-Stock Rate
Shows how often products are unavailable.
Formula:

Target: < 5%
Every out-of-stock means lost revenue and potentially a lost customer who buys from a competitor.
6. Product KPIs: The Performance of Your Assortment
Product-related metrics help with assortment decisions.
Bestseller Analysis
Identify your top products by different criteria:
- Top 10 by Revenue: Your revenue drivers
- Top 10 by Margin: Your profit generators
- Top 10 by Units Sold: Your volume drivers
Product Margin per SKU
Formula:


Sort your assortment by margin and identify:
- Stars: High margin, high sales → Advertise and push
- Cash Cows: Low margin, high sales → Traffic drivers
- Question Marks: High margin, low sales → Marketing potential
- Dogs: Low margin, low sales → Phase out
Sell-Through Rate
Shows how quickly a product sells.
Formula:


Example Calculation:
- Purchased Quantity: 500 units
- Sold in 30 days: 350 units
- Sell-Through = (350 / 500) × 100 = 70%
Assessment:
-
80%: Reorder, possibly raise price
- 50–80%: Good performance
- < 50%: Review marketing measures or price reduction
7. KPI Dashboard & Tools
To keep track of all these metrics, you need the right tools.
Google Analytics 4
Free and indispensable for:
- Traffic analysis
- Conversion tracking
- E-commerce tracking (revenue, AOV, CVR)
- User behavior
Setup Tip: Set up Enhanced E-Commerce Tracking to get detailed data on carts, product performance, and checkout funnel.
Shopify Analytics / WooCommerce Reports
Directly in your shop system:
- Revenue and orders
- Product performance
- Customer statistics
- Marketing channel attribution
Klaviyo (Email Marketing)
Specifically for email KPIs:
- Open rate
- Click rate
- Revenue per email
- Unsubscribe rates
- CLV tracking
Triple Whale / Northbeam (Attribution)
For advanced marketing attribution:
- Cross-channel attribution
- Blended ROAS / MER
- CAC and CLV tracking
- Cohort analyses
Custom Dashboard
For a quick overview, I recommend a weekly KPI dashboard with the most important metrics:
| KPI | Target | Current | Trend |
|---|---|---|---|
| Revenue | $220,000 | ? | ↑↓ |
| AOV | $88 | ? | ↑↓ |
| Conversion Rate | 2.5% | ? | ↑↓ |
| ROAS | 4.0 | ? | ↑↓ |
| CAC | < $55 | ? | ↑↓ |
| Return Rate | < 25% | ? | ↑↓ |
Conclusion: KPIs as the Compass for Your E-Commerce Success
Metrics aren’t an end in themselves—they’re your navigation system for data-driven decisions. The key takeaways:
-
Focus on profitability: Revenue is important, but contribution margin and profit margin determine success.
-
CLV:CAC Ratio as your north star: This metric shows whether your business model is sustainably scalable.
-
Optimize conversion rate: Often the biggest lever—a small improvement impacts all other KPIs.
-
Keep returns under control: A decisive cost factor that can make or break profitability.
-
Measure regularly and take action: A dashboard that nobody looks at is useless. Establish a weekly KPI review.
Use KPIs in combination with modern technologies. How AI in e-commerce can help you improve these metrics—from automated product copy to personalized recommendations—you can learn in my separate article.